Climate Stripes for Italy, an analysis of actual climate change in provinces and regions.
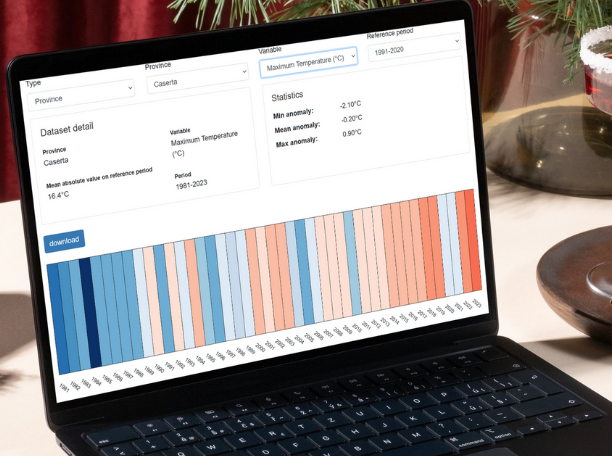
A new service is available on Dataclime, the climate service developed by CMCC, which offers the possibility to consult and download a series of Climate Stripes for the regions and provinces of Italy, based on data from the VHR_REA-IT climate reanalysis at 2.2 km of resolution, covering the period from 1981 to 2023.
The Climate Stripes are a visual representation of the average, minimum and maximum temperature variations, using colors that allow the recorded changes to be immediately indicated, through a chromatic range.
- Blue: highlights negative differences compared to the average value of the thirty-year reference period.
- Red: highlights positive differences compared to the average value of the thirty-year reference period, for each year.
This tool allows the user to view temperature trends in a simple and intuitive way, clearly showing how the different Italian areas are already experiencing climate change. This visual representation aims to support awareness and the development of planning activities for adaptation policies to the changing climate.The data used to create the Climate Stripes are those available on the CMCC Data Delivery System service, the platform for consulting and sharing climate data.
To view the Climate Stripes in your region or province, you need to register on the Dataclime website, access the service and enter the data of interest. The stripes are available both for a dynamic consultation and for download.