The first interactive classification of extreme events in Italy
Goals:
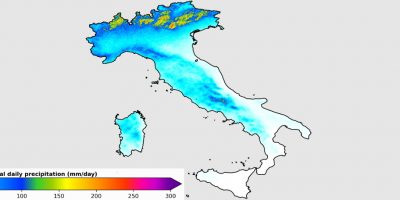
The climate service Extreme events monitoring represents an interactive classification of extreme events on the Italian territory providing to users with different results including maps, weather reports and high resolution climate analysis
The service is based on the use of model reanalysis (ERA5* ed ERA5@2km**) which are a very powerful tool, that, by consistently combining numerical modelling with observations (through the use of data assimilation techniques), can provide a consistent and robust representation of the current climate.
This climate service takes into consideration principal meteorological events that have socio-economic impacts which are warm and cold anomalies, heavy rainfall, drought and storms associated with different atmospheric parameters. The events, classified according to their occurrence and magnitude (for example moderate, severe, extreme), are displayed through daily summary maps and made available through CSV files on an hourly basis (with temporal and spatial location).
In addition, for the events considered most impacting, the service provides tailored meteorological reports which describe the evolution of the phenomena that determined the event, and that collect links to testimonies of the by the events, coming from the newspapers that describe them. The service can provide both information about the current year but also go back in time.
Methodology:
For the classification, the reference period was chosen for the period 1991-2020 and the event types are compared in terms of percentile*** defining three following classes (Rare, Extreme and Exceptional), with the exception of droughts where classification has been applied (McKee et al., 1993 e WMO, 2012).
Dataclime functionalities:
Within the Dataclime platform through the product “Extreme events monitoring”, the (registered) user can view and download the maps with their csv file containing information about the event and weather reports for the days of interest. Registered users can download the first three months of 2022 for free in order to evaluate the potential of the service.
Notes:
*Reanalysis available within the platform Copernicus C3S
**Reanalysis produced by CMCC providing high definition climate data (available untile 31/10/2021). For more information, you can see:
https://www.mdpi.com/2306-5729/6/8/88/htmVHR-REA_IT Dataset: Very High Resolution Dynamical Downscaling of ERA5 Reanalysis over Italy by COSMO-CLM
*** Percentiles for anomalies of warm and cold are calculated on a 5-day moving window centered on the day of interest.
Reference and link:
Ispra, 2013: Variazioni e tendenze degli estremi di temperatura e precipitazione in Italia 37/2013.
McKee, T.B., N.J. Doesken, and J. Kleist, 1993: The relationship of drought frequency and duration of time scales. In Proc. of Eighth Conference on Applied Climatology, American Meteorological Society, January 17–23, 1993, Anaheim CA.
Raffa, M.; Reder, A.; Marras, G.F.; Mancini, M.; Scipione, G.; Santini, M.; Mercogliano, P. VHR-REA_IT Dataset: Very High Resolution Dynamical Downscaling of ERA5 Reanalysis over Italy by COSMO-CLM. Data 2021, 6, 88. https://doi.org/10.3390/data6080088.
WMO–World Meteorological Organization, 2012: Standardized Precipitation Index User Guide (M. Svoboda, M., Hayes, M., Wood, D.). WMO-No. 1090, Geneva, 24pp.
https://cds.climate.copernicus.eu/#!/home
https://www.cmcc.it/it/articolo/giornata-della-terra-ecco-la-mappa-degli-eventi-estremi-in-italia